


We’re in an age where there’s so much data and a shortage of analysts (and time) to sift through it all. So, tools become absolutely necessary. And these tools are evolving to empower less technical folks – like marketers – to analyze and visualize their own large data sets. In this post, we’ll walk you through using the Google stack – BigQuery, Cloud Storage, and Google Data Studio – to do just that.
Getting Started with BigQuery
BigQuery is a SQL-based data warehouse platform that allows users to easily query up to petabytes of data. For smaller data sets (flat files under 10MB), it’s completely free to use and test out. For larger data sets (flat files over 10MB), you can upload to Google Cloud Storage and store the data there for only $0.023 per GB per month, which is dirt cheap. That works out to about $27/year to store and query a TB of data.
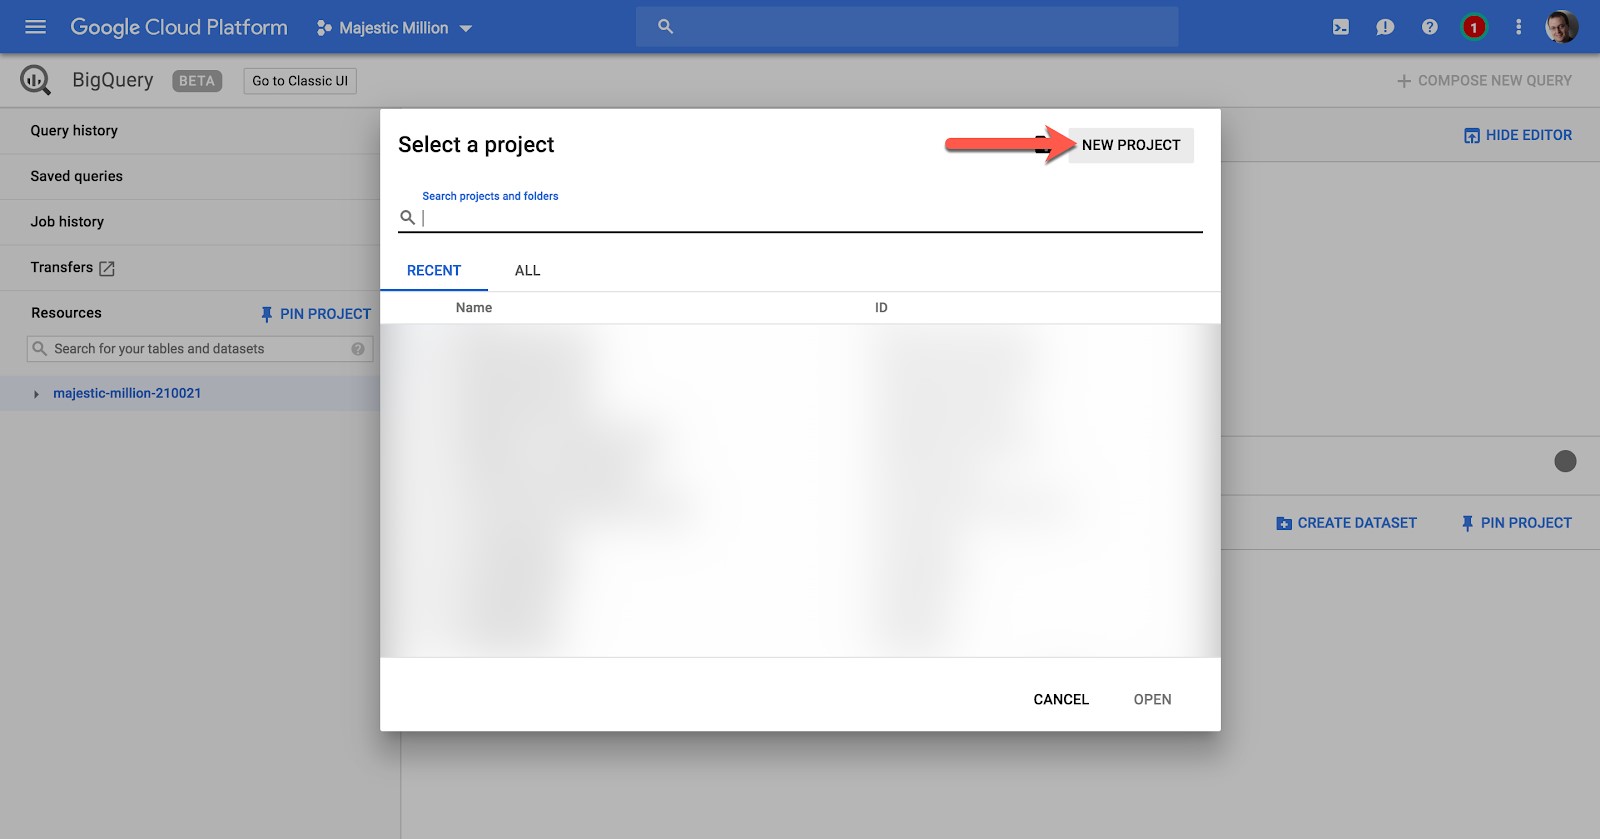
Creating a BigQuery Project
To get started with BigQuery, you’ll need to create a project.
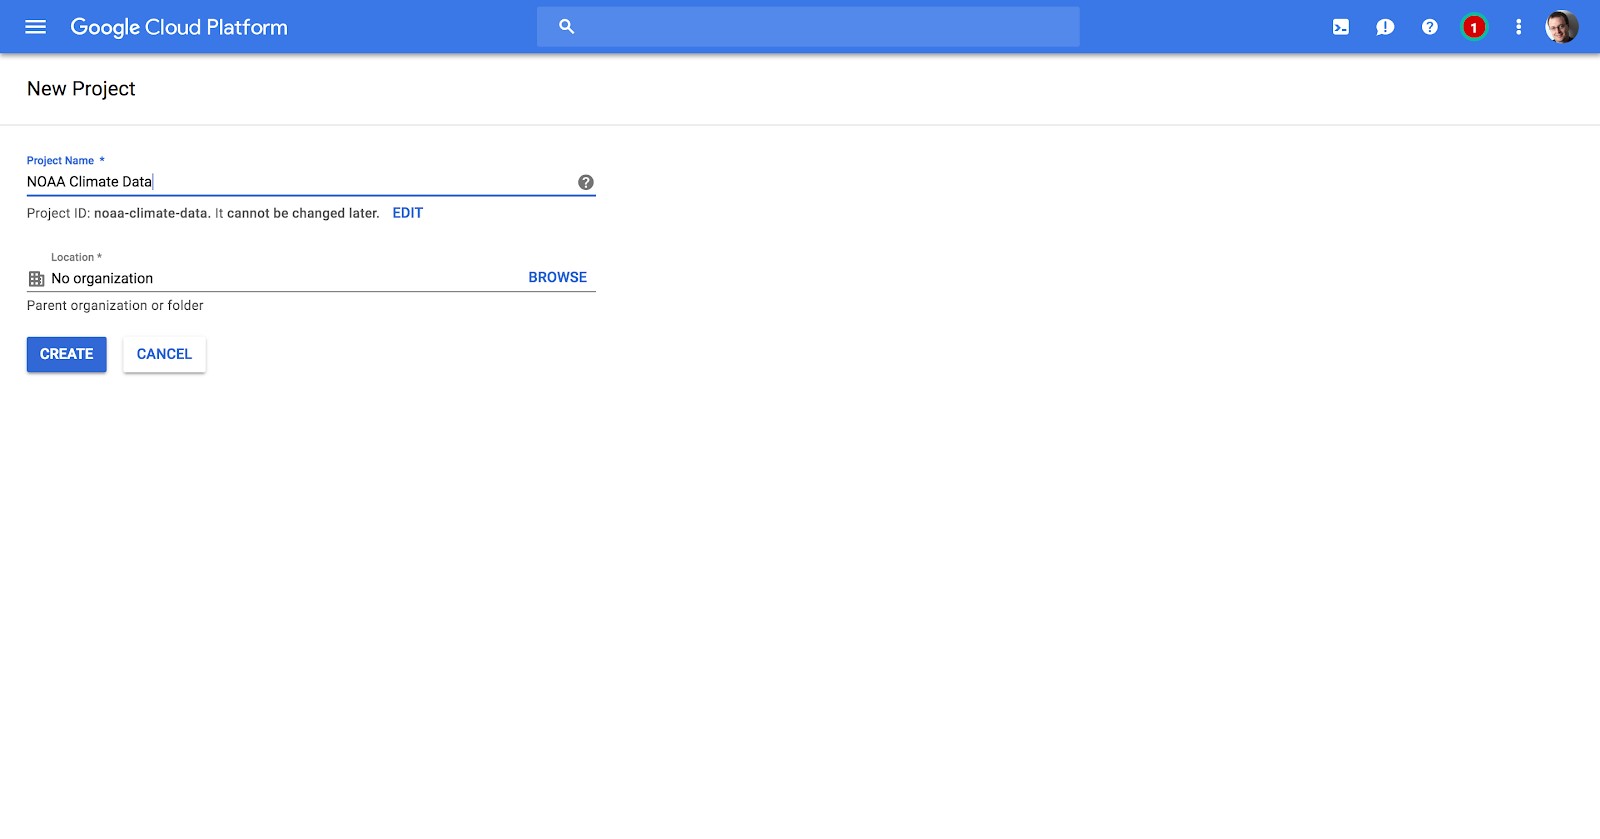
 Name your project whatever makes sense to you. (In this case, I’m uploading US climate data from the NOAA.)
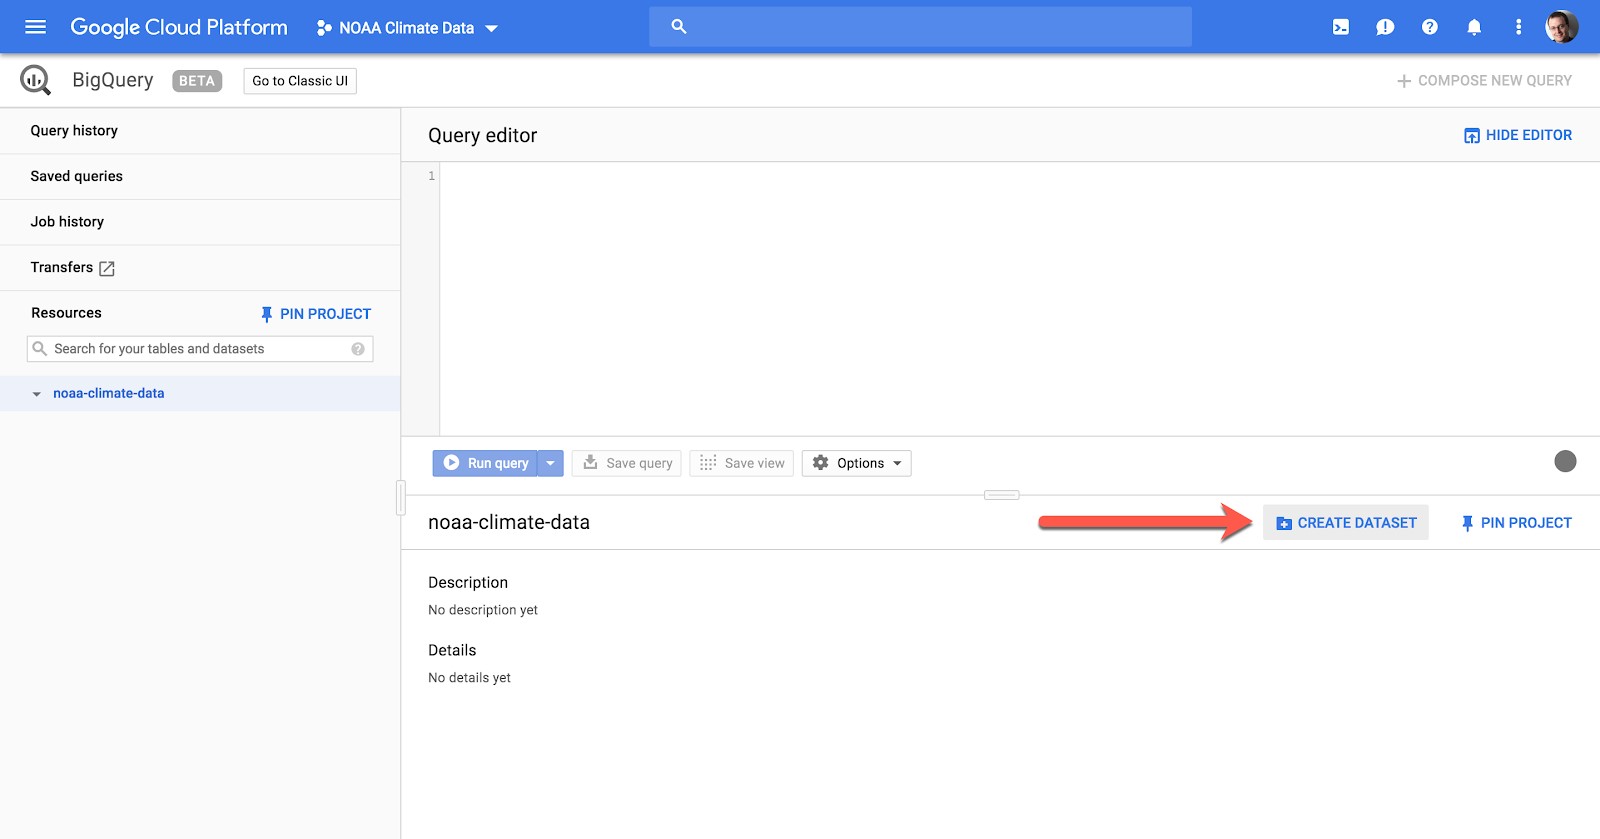
 Then you’ll want to create a dataset. This is pretty arbitrary, as long as you can remember it. The important part is the table name, which we’ll address later.
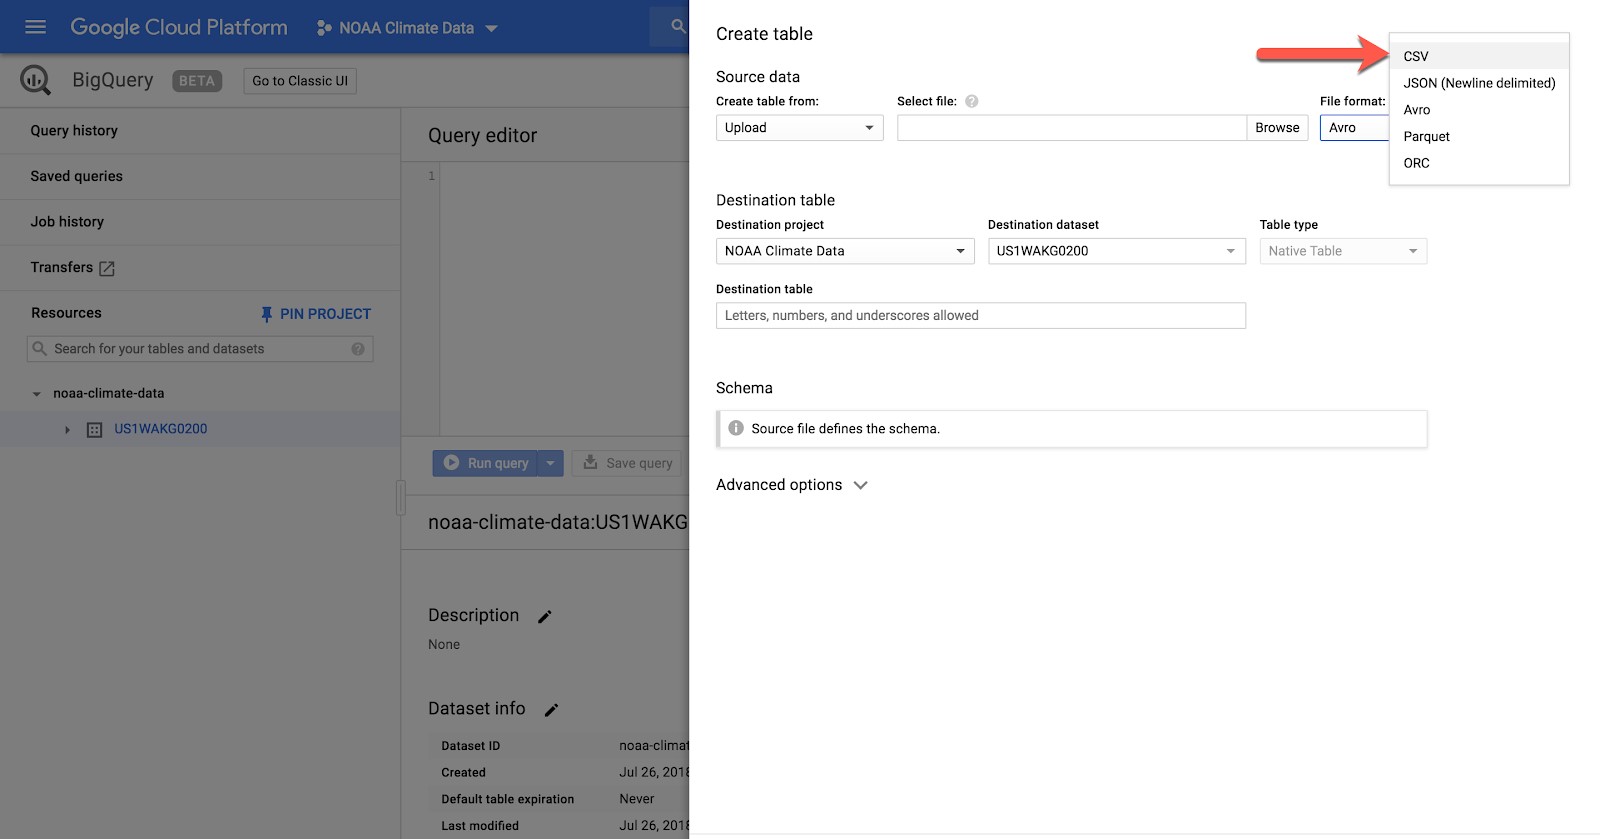
 Once your dataset is created, this is where you can create a table and upload your flat file data into it.

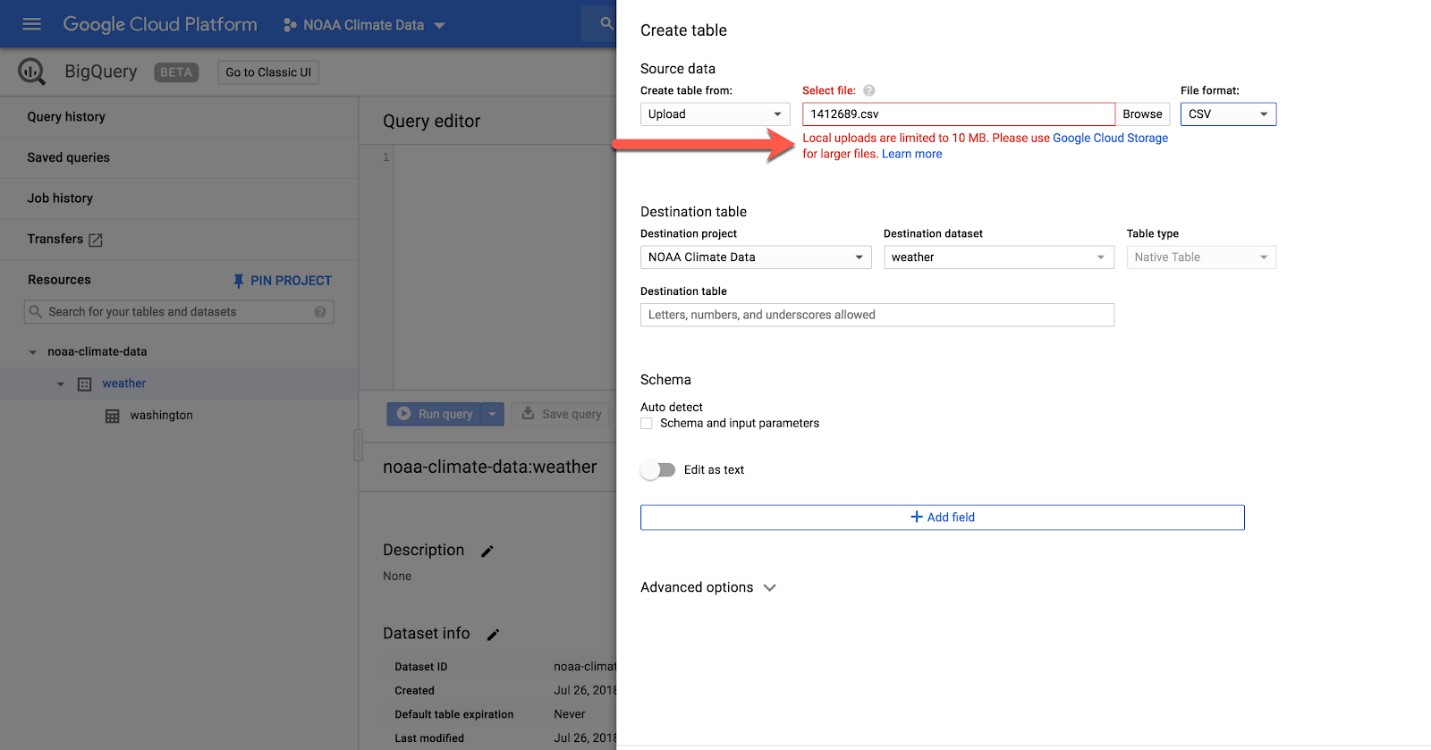
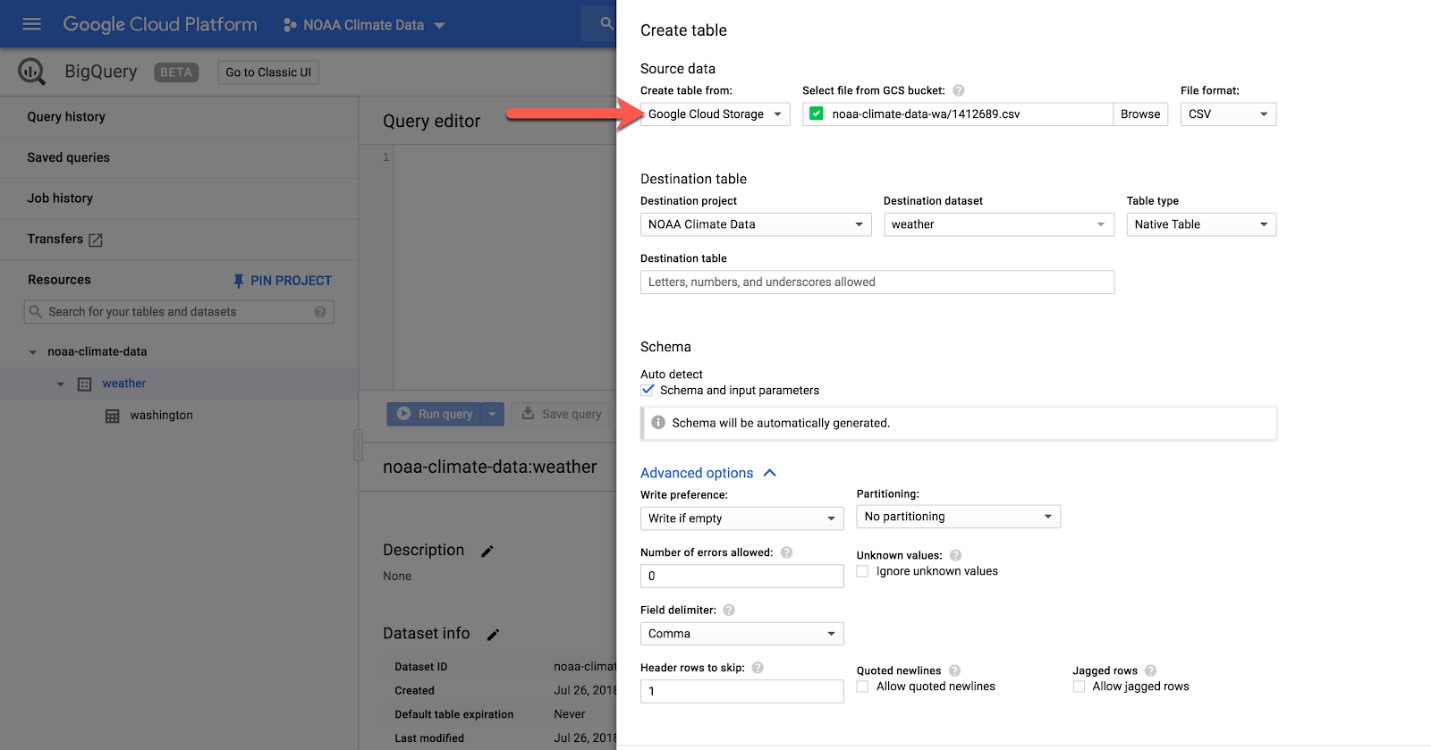
Choose to create a table from “upload” and select the “.csv” file format
 I named my table “seattleweather” because I only downloaded Seattle’s data from the NOAA (I was lazy and didn’t want to wait all night for the .csv to download for all of America).
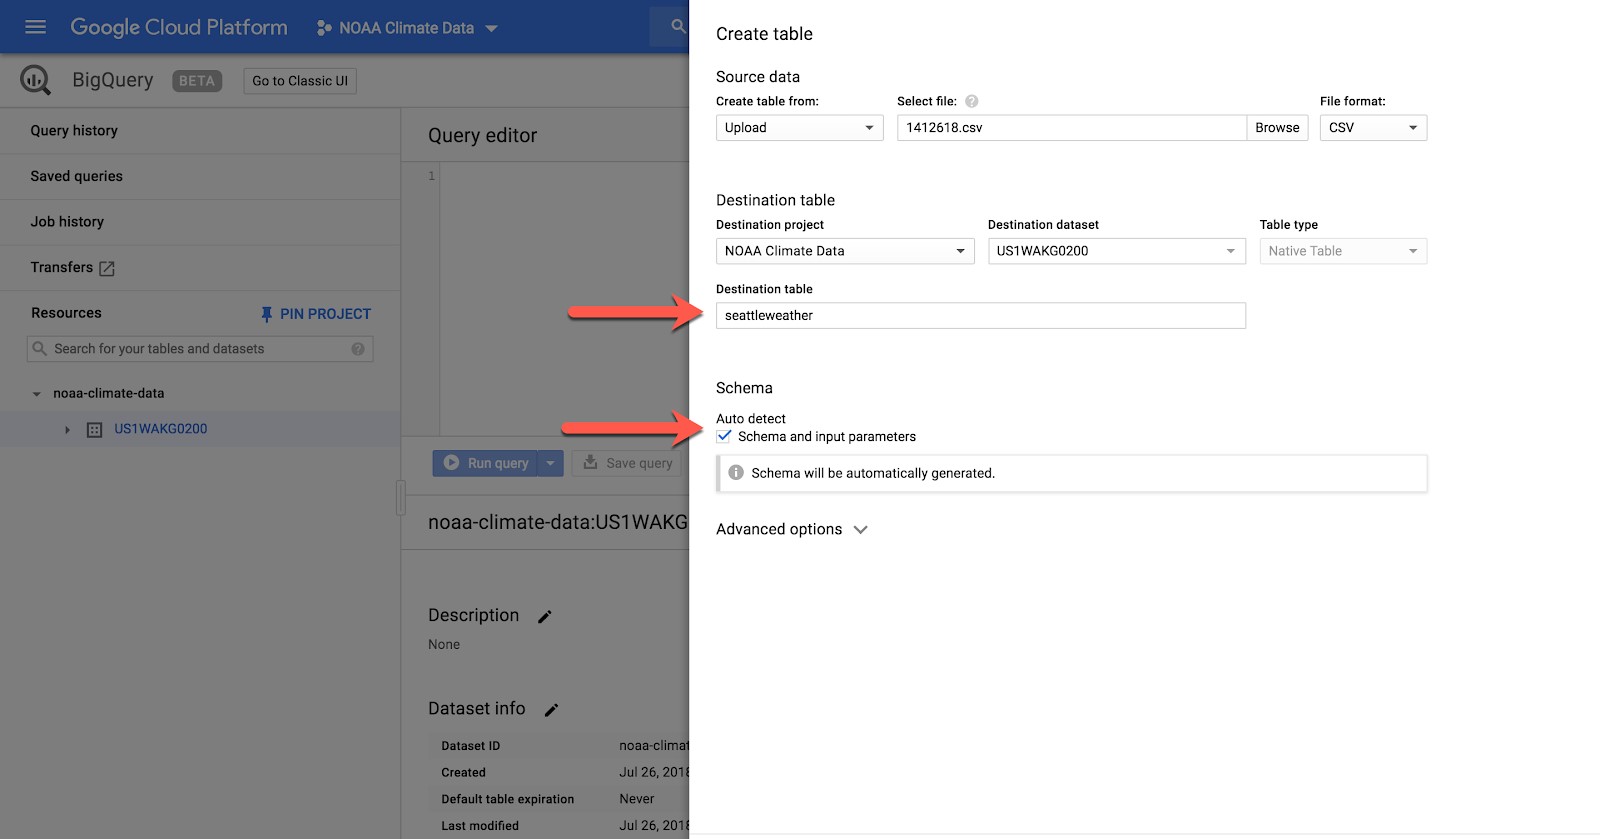
Also, remember to check the “auto-detect” schema option. (This means it’ll interpret the column headers and data types for you instead of having to set those manually.)
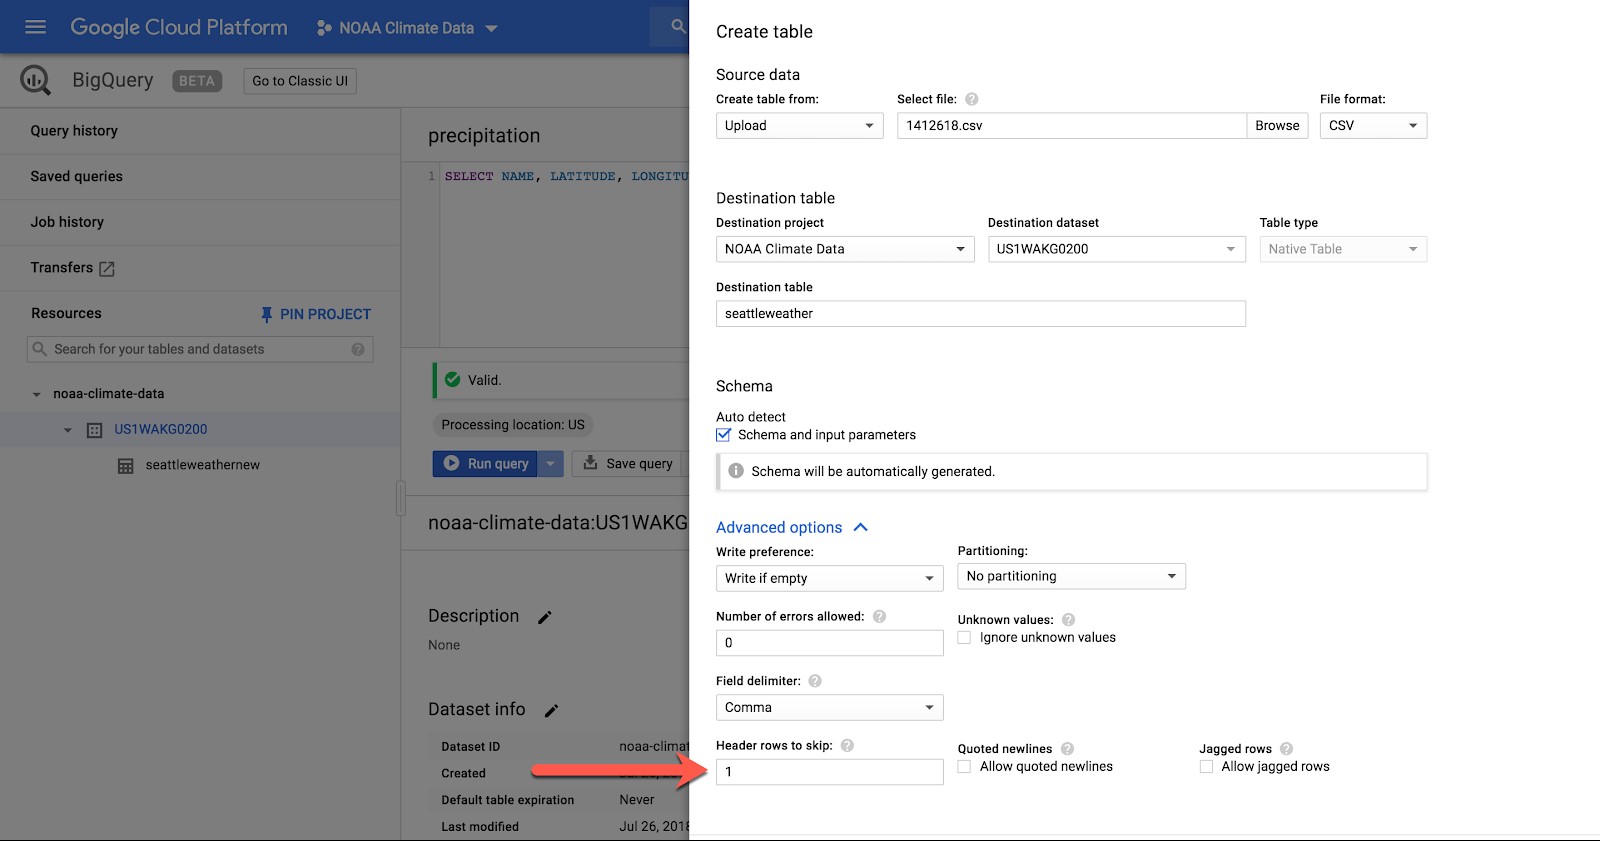
Very important to ensure you put “1” in the header rows to skip field under the advanced options. (That tells BigQuery the data starts in Row 2.)
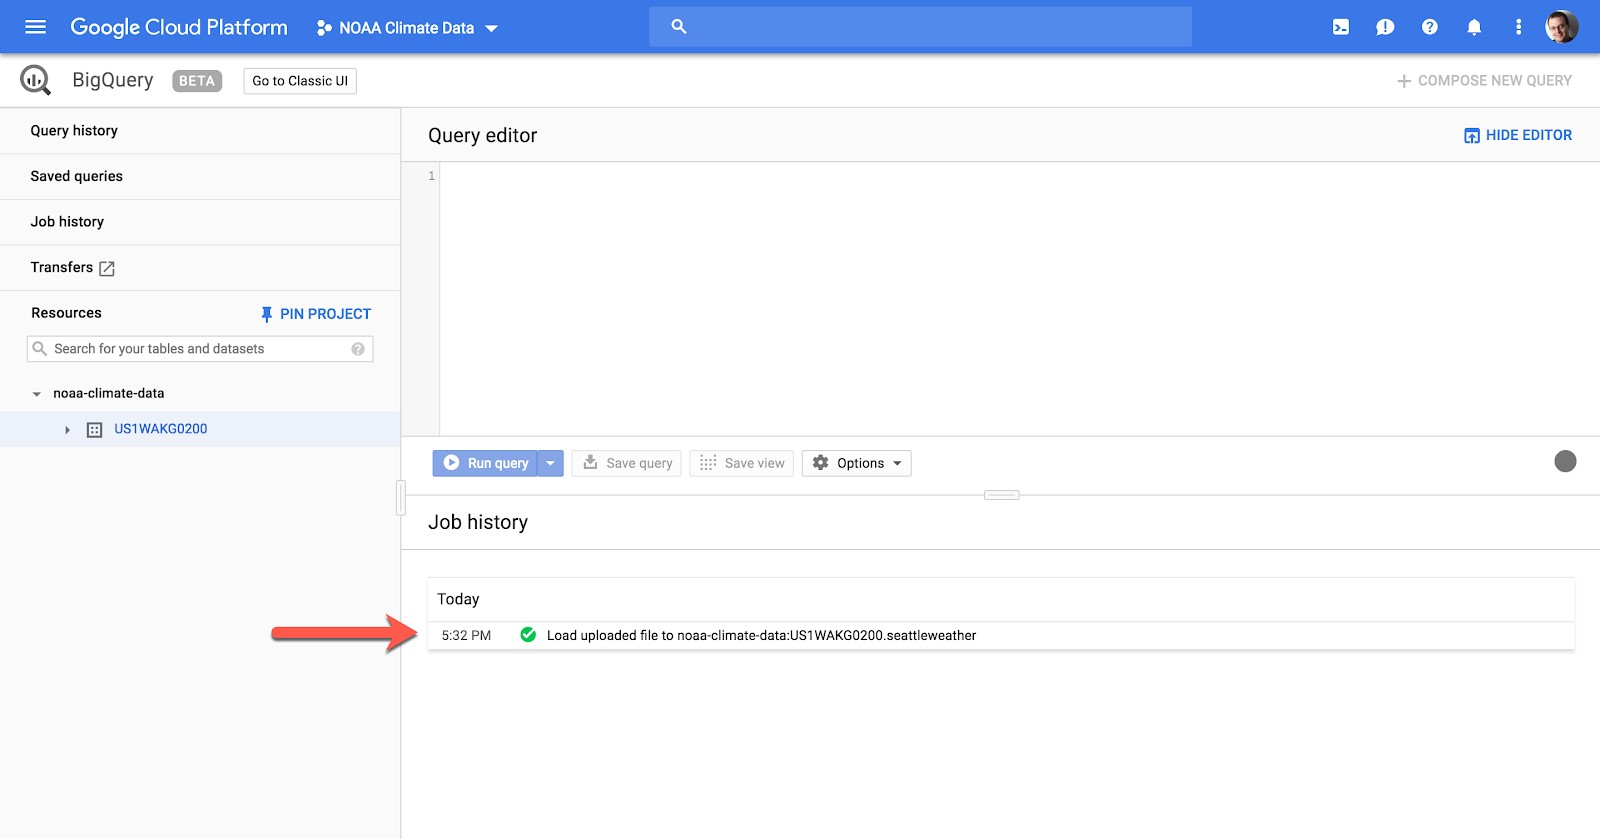
 Once you finish entering those settings, click upload and if everything worked, you’ll get a confirmation in the dashboard and you can jump to your table. This process may take a while depending on the size of your file.
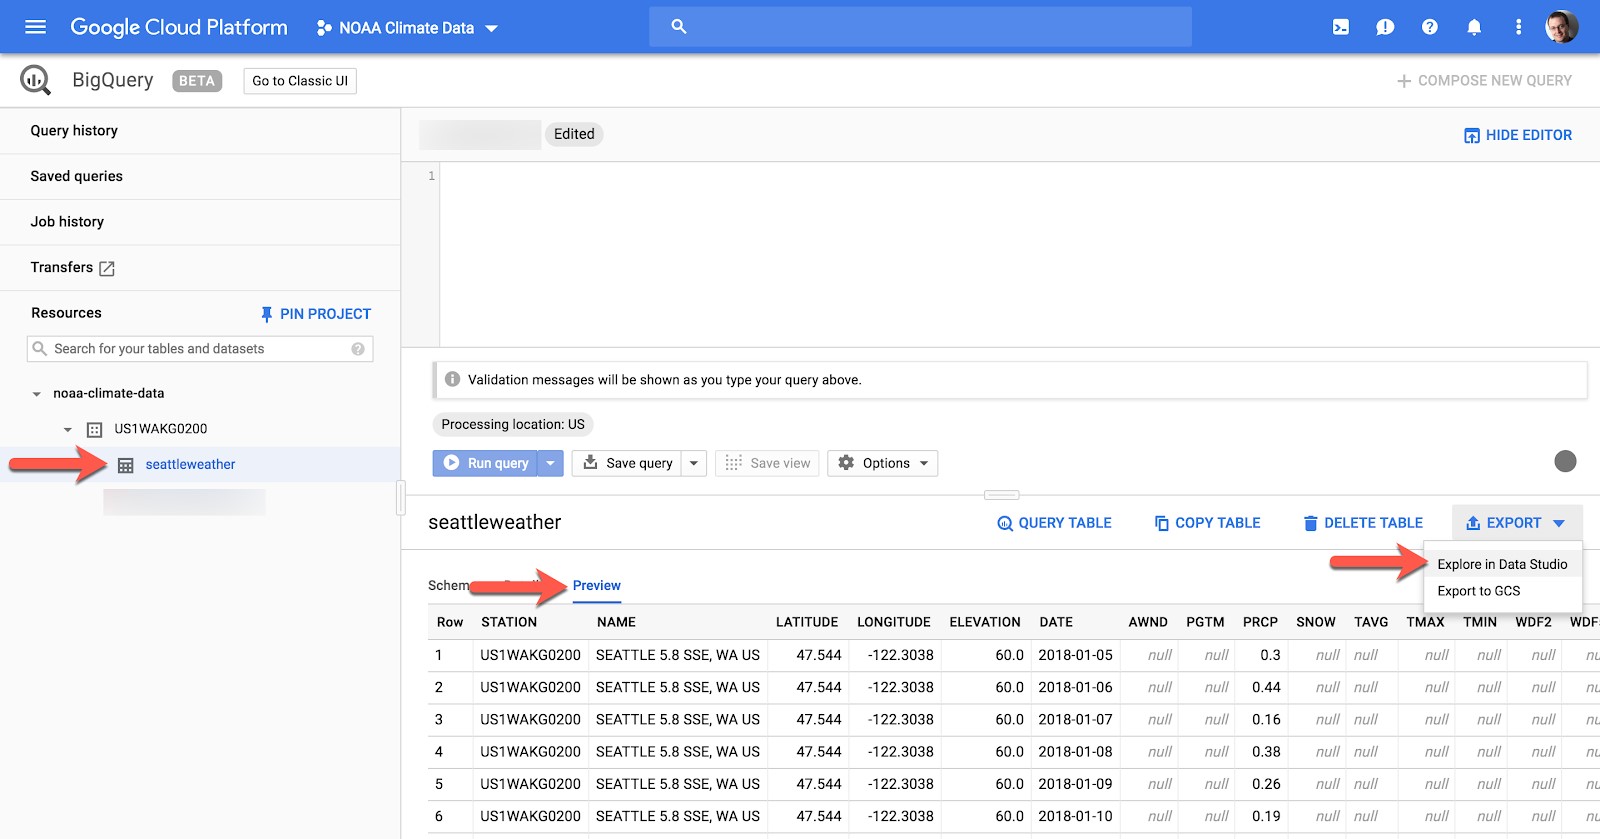
Click on your table name under the project and dataset, then click on the preview tab to make sure the table looks clean, and you can one-click “Explore” in our next stop: the visualization tool Google Data Studio!
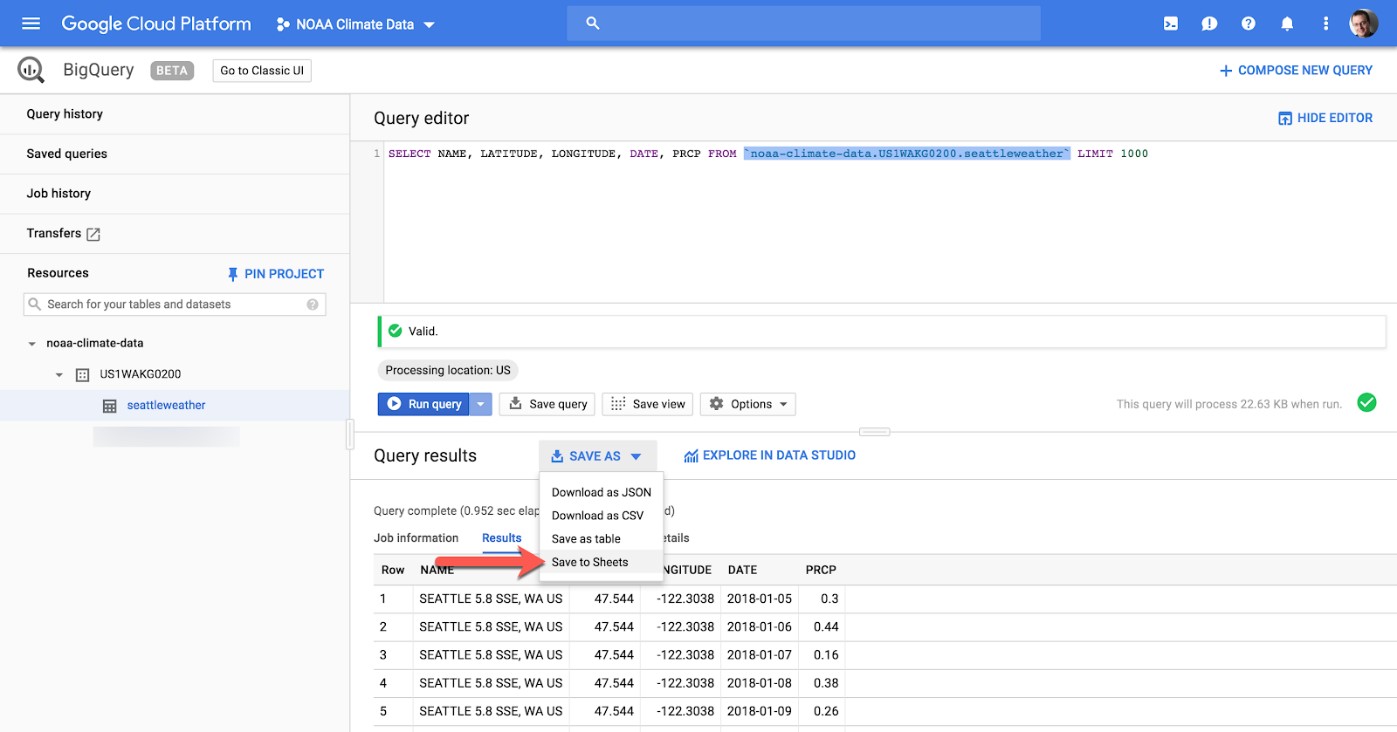
I promised this post would be friendly for folks that don’t know any code, but if you’re familiar with SQL and you’re feeling adventurous, you can also query a subset of the BigQuery table and simplify what you’re outputting to Google Data Studio or Google Sheets.
Using Google Cloud Storage for larger flat files
Before we jump into visualizing the data, there’s one more component to this I want to touch on: handling large files. The method I described above works for files under 10MB. The majority of truly big data files are far larger than that, sometimes gigabytes or terabytes in size. That’s where Google Cloud Storage comes in.
When you try to upload a file larger than 10MB, it’ll throw you an error on the BigQuery table creation screen with a link to Google Cloud Storage.
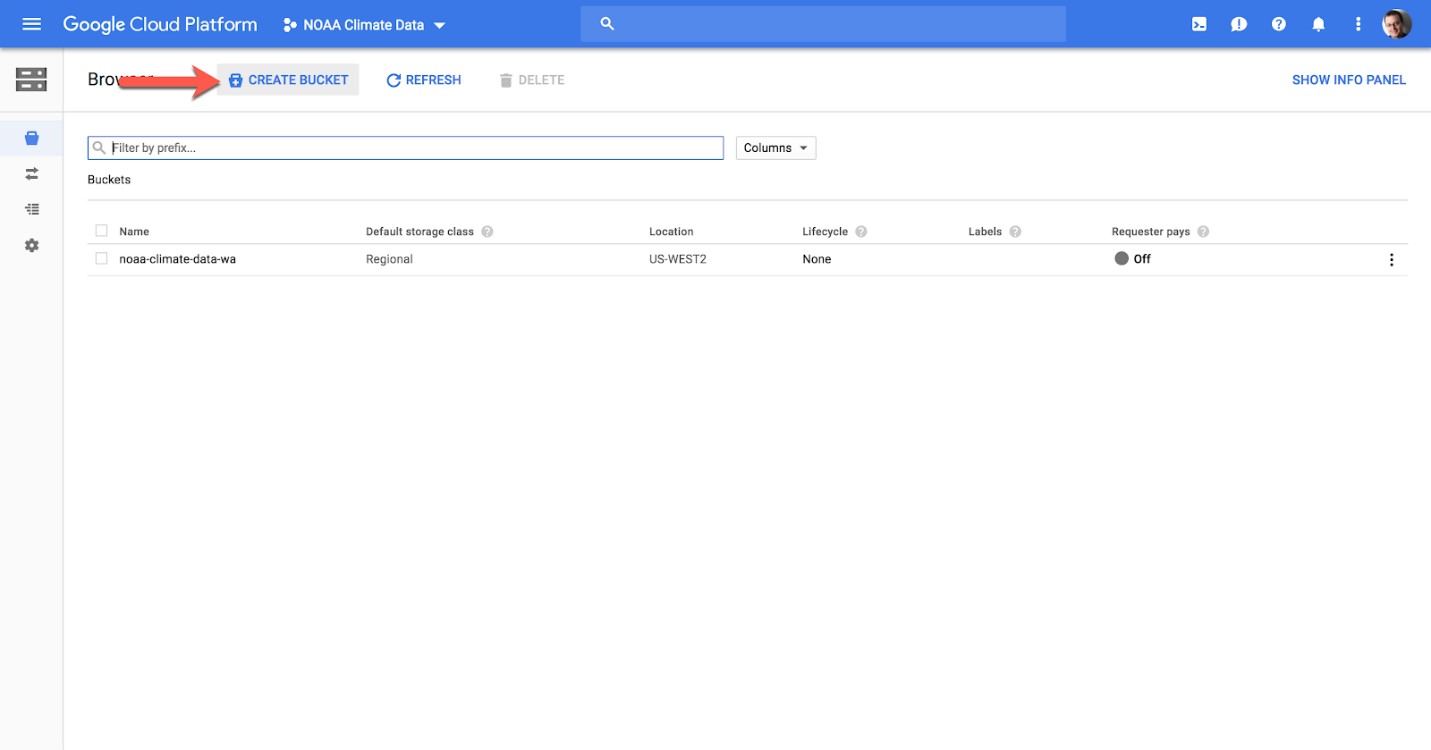
Follow that link and you’ll be prompted to create a bucket. A “bucket” is essentially a secure folder in the cloud where your flat files will live:
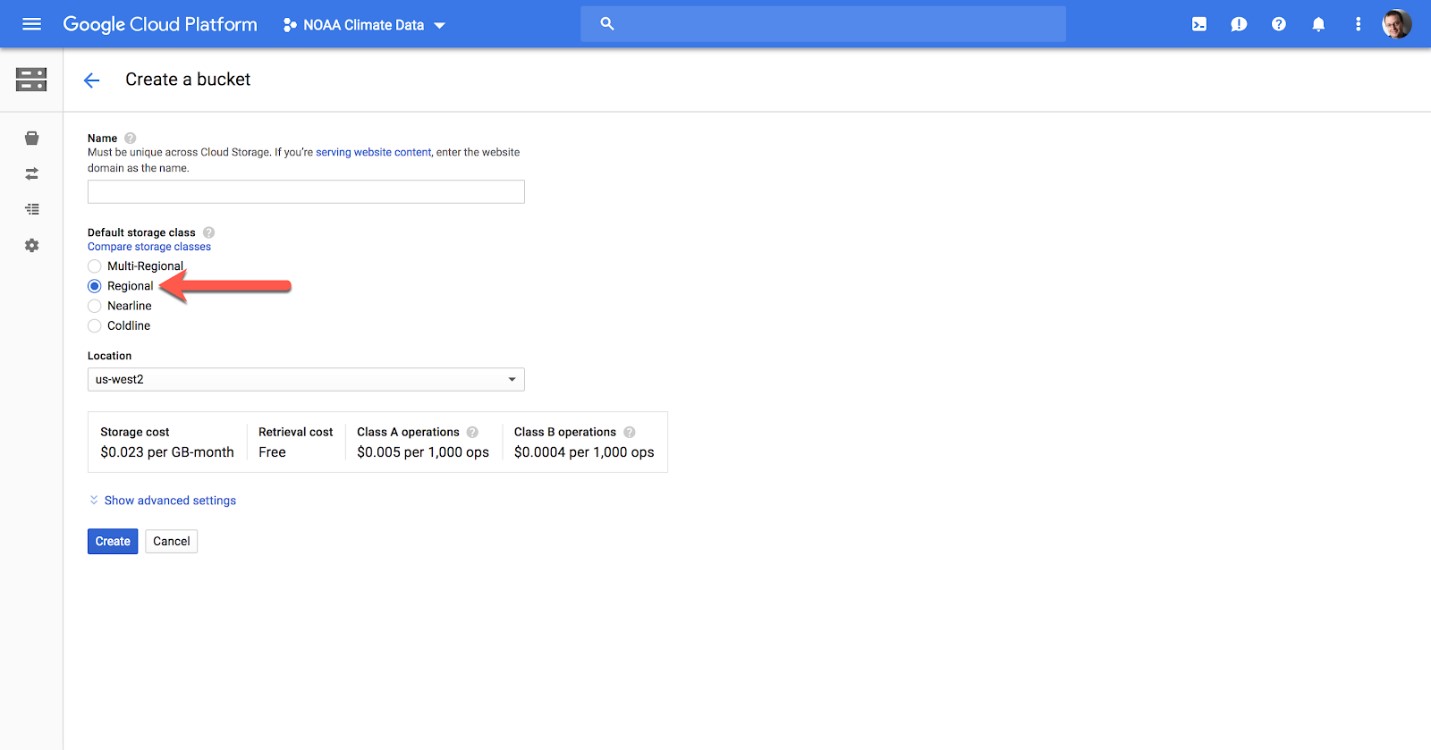
Name the bucket something memorable and unique and make sure you choose “Regional” storage class. It’s dirt cheap to store data that way per GB, and free to retrieve the data.
Once the bucket is created, you can drag and drop files from your desktop or data warehouse servers to it.
Then you can go back to create a table in BigQuery and choose Google Cloud Storage this time, selecting your file from the newly created bucket, with all the other options I mentioned in the .csv upload walkthrough above.
Visualizing with Google Data Studio
Once you’ve clicked the “Explore in Data Studio” option after successfully uploading your data set in BigQuery, you’ll be whisked away to a slick visualization tool where you can drag and drop dimensions and metrics from your table.
Data Studio is Google’s answer to Power BI or Tableau and it has a lot of built-in connectors, not just to BigQuery data, but also to Google Analytics, ad platforms of all kinds, and Google Sheets.
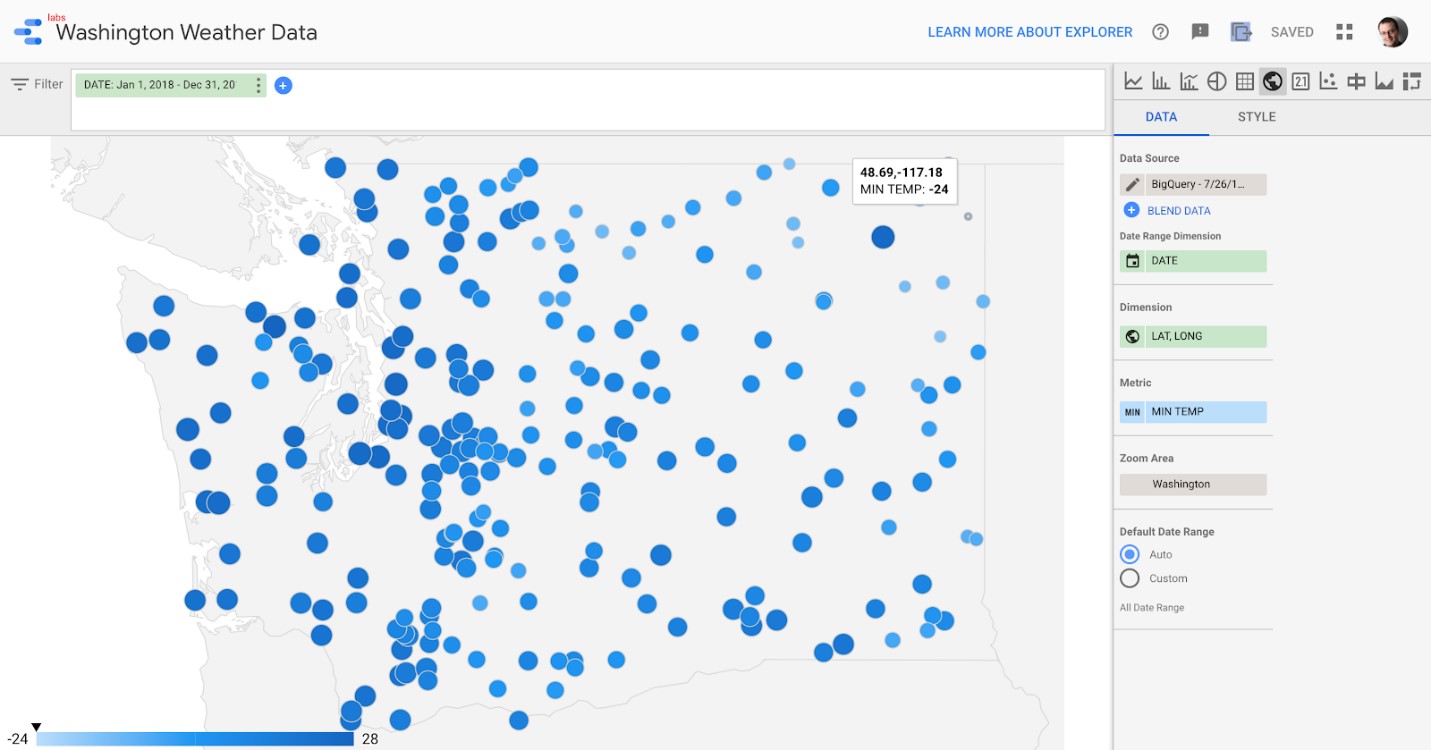
Here’s an example. I made a visualization of the lowest minimum temperatures recorded in every weather station in Washington State last year. (Turns out, it was -24 degrees somewhere in Northeastern WA.)
You can also look at the change in a metric over time. Here I’ve plotted measurable rain in the first 7 months of 2018 at Seattle’s Boeing Field weather station. You have plenty of options to style these data points visually too, with different colors and different aggregations. I chose a cumulative aggregation mode here.
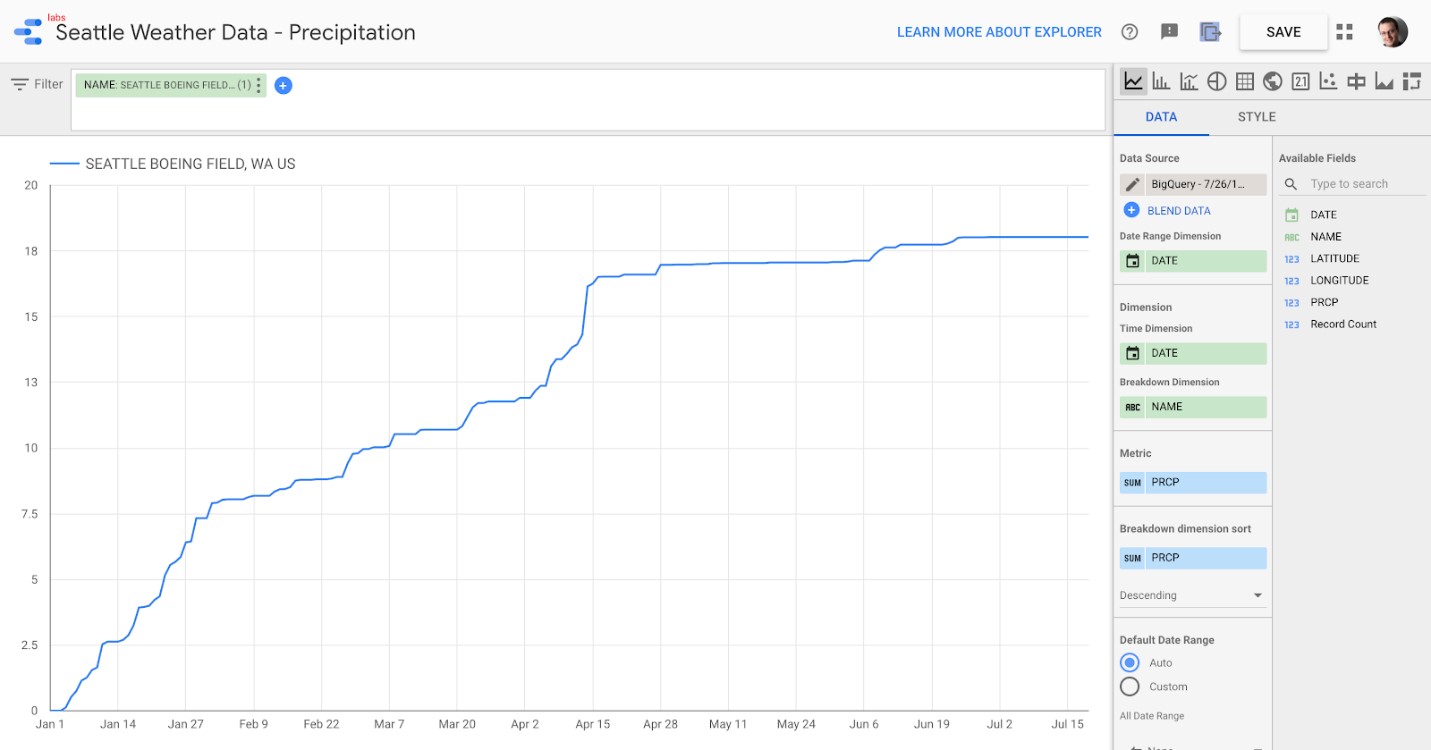
As you can tell from the screen above, Data Studio makes it incredibly easy to literally drag and drop the metrics you want to visualize, select date ranges with relevant data, and even re-label certain data points in the legend, which is a great way to make your data sets consumable for a wider audience.
Once you’re satisfied with the visualizations you’ve built from your BigQuery data, you can make them publicly accessible, interactive, and embeddable anywhere on the web!
See, no code necessary!
Although knowing code certainly helps data scientists carve through huge data sets and analyze them more intensively, hopefully, this walkthrough with BigQuery and Google Data Studio demonstrates just how low the barriers to entry are in working with big data now.
I encourage those of you just getting into the field not to be intimidated and jump right in. Organizations are sitting on piles of unused data and they need our help to act on it!